Projects

ROI-Optimized React

hive plot

Need to link: In progress blog post ROI-focused architecture optimizations.

Maybe link: Related composable-react-architecture repo from 2016/17. May eventually update it now that React Hooks enable a much cleaner and simpler implementation. Also needs unit/integration tests to show how they would work. One thing at a time…

Tech in that example: React, Redux, Recompose, GraphQL, create-react-app (i.e., webpack).

Personal Utilities

lambda character with hexagonal nut

Experimental monorepo to develop/build/test/package/publish/import multi-langugage personal utilities. Currently functional-programming-focused JS and Python, plus a few experimental post-hooks-release React utils.

Tech: Lerna, Yarn Workspaces, React, Jest, XStream, and PyUnit.

Human Change

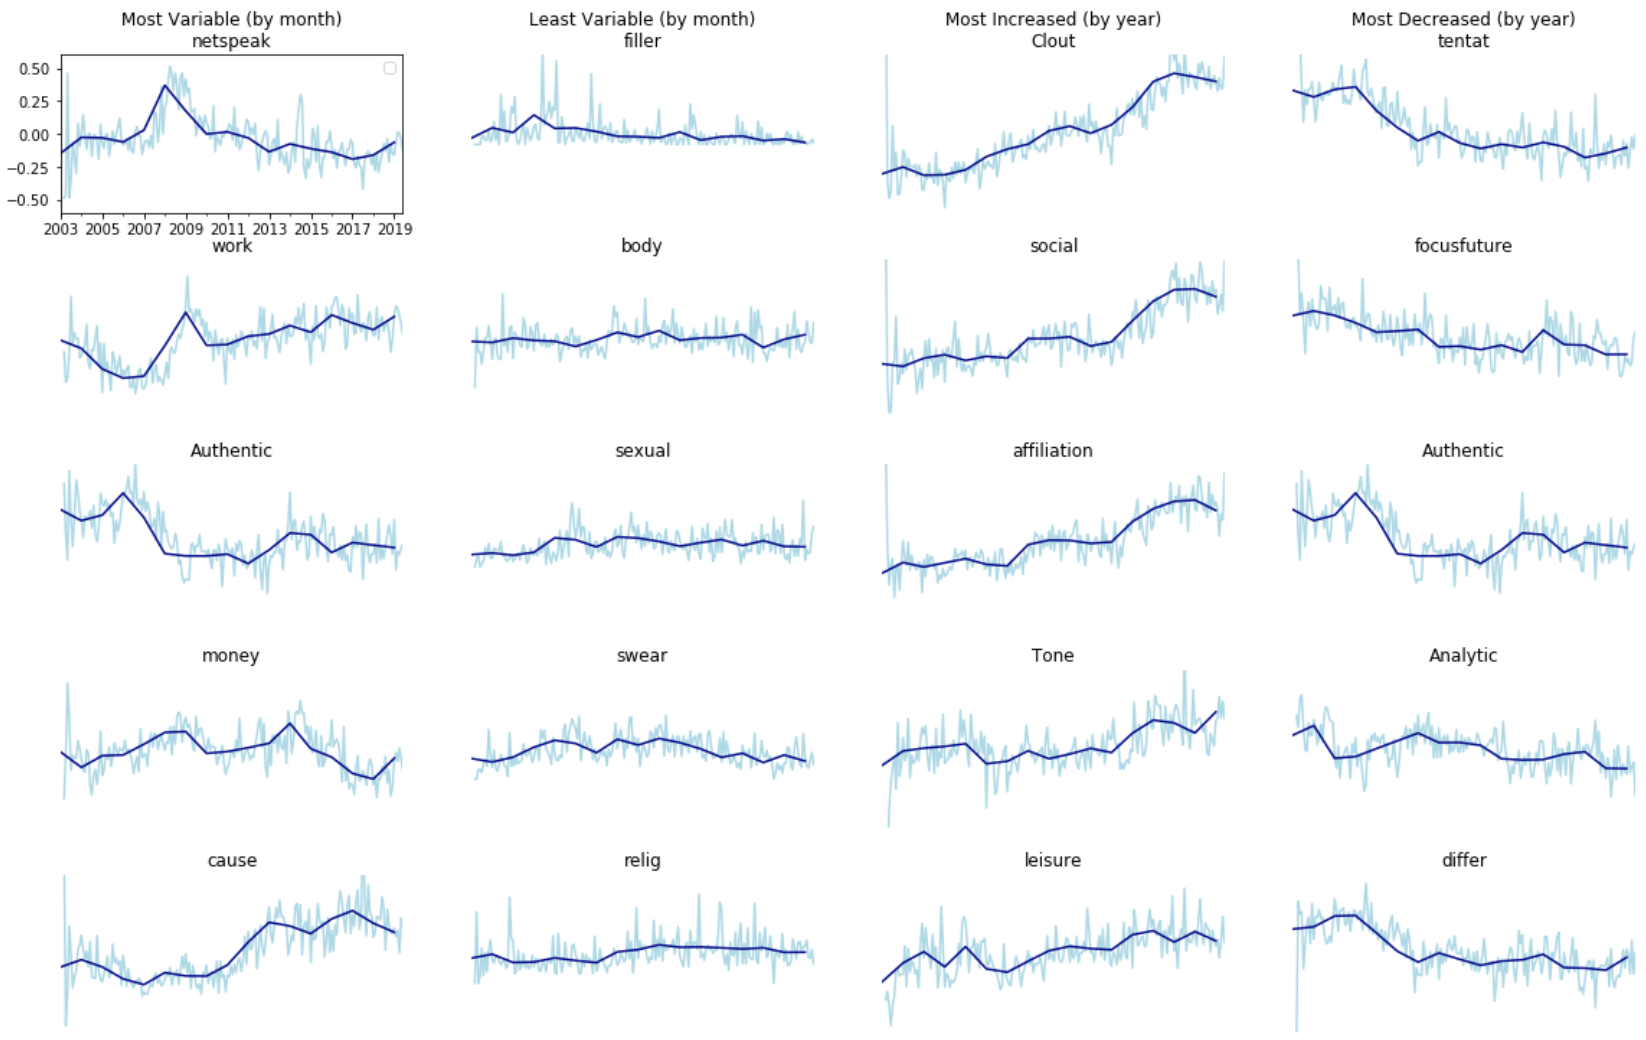
charts showing psych characteristic change

A personal interest of mine is measuring/modeling/visualizing psychological change/growth. As part of a data mining course, I led a project exploring what we can learn from a long-running blog with NLP (Natural Language Processing) and linguistic analysis. Data gathered myself with a custom crawler/scraper. Overview Slides PDF. Code:scrape/crawl, transform/clean, analysis notebook

Tech: Puppeteer+Node.js Crawler/Scraper. Python. Pandas. LIWC. spaCy. Skikit-learn.

Oura Exploration

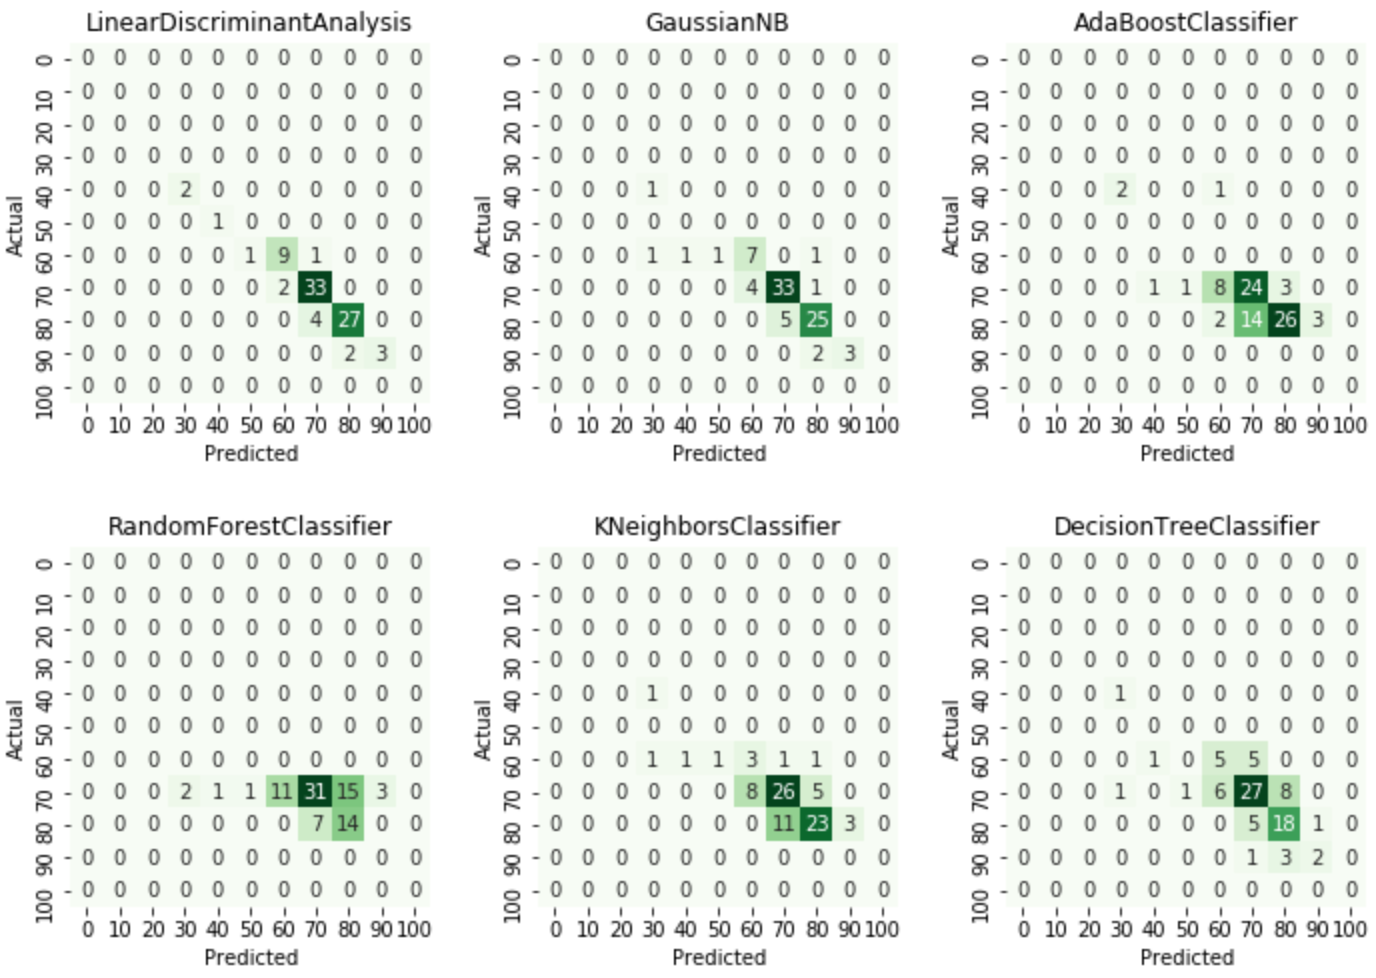
confusion matrices

Exploring scikit-learn classification algorithms on wearable sensor data. Co-written with a partner for a data science course. Code mine. Data from my Oura Ring.

Tech: Python, Pandas, Matplotlib, Scikit-learn, Scipy, Seaborn.

"Heart-A-Tracker" Dev Process + Wearable Data Prediction

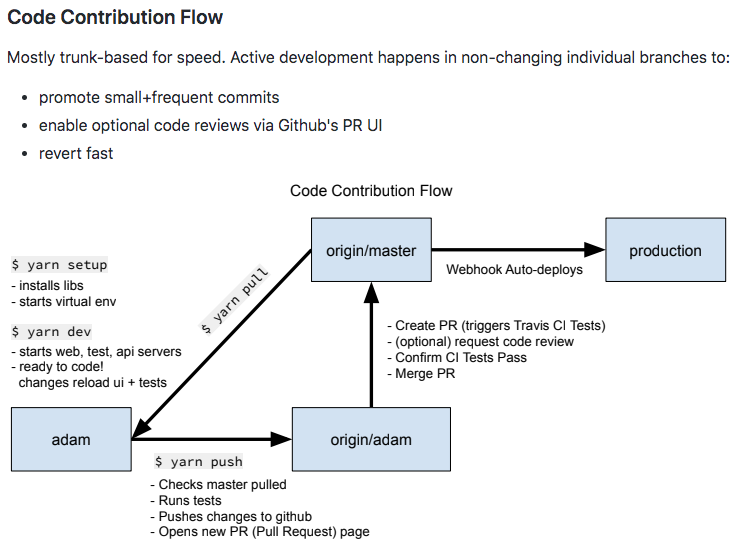
Code contribution flowchart

Predicting wearable data with neural networks for a course. Prediction mostly a colleague’s. Devops mine. Love an efficient CI/CD process. We started with React Native then chose to go web instead.

Tech: Apollo GraphQL (Server and Client), React, Recharts, lodash/fp, TravisCI, Heroku.

Cost Per Change

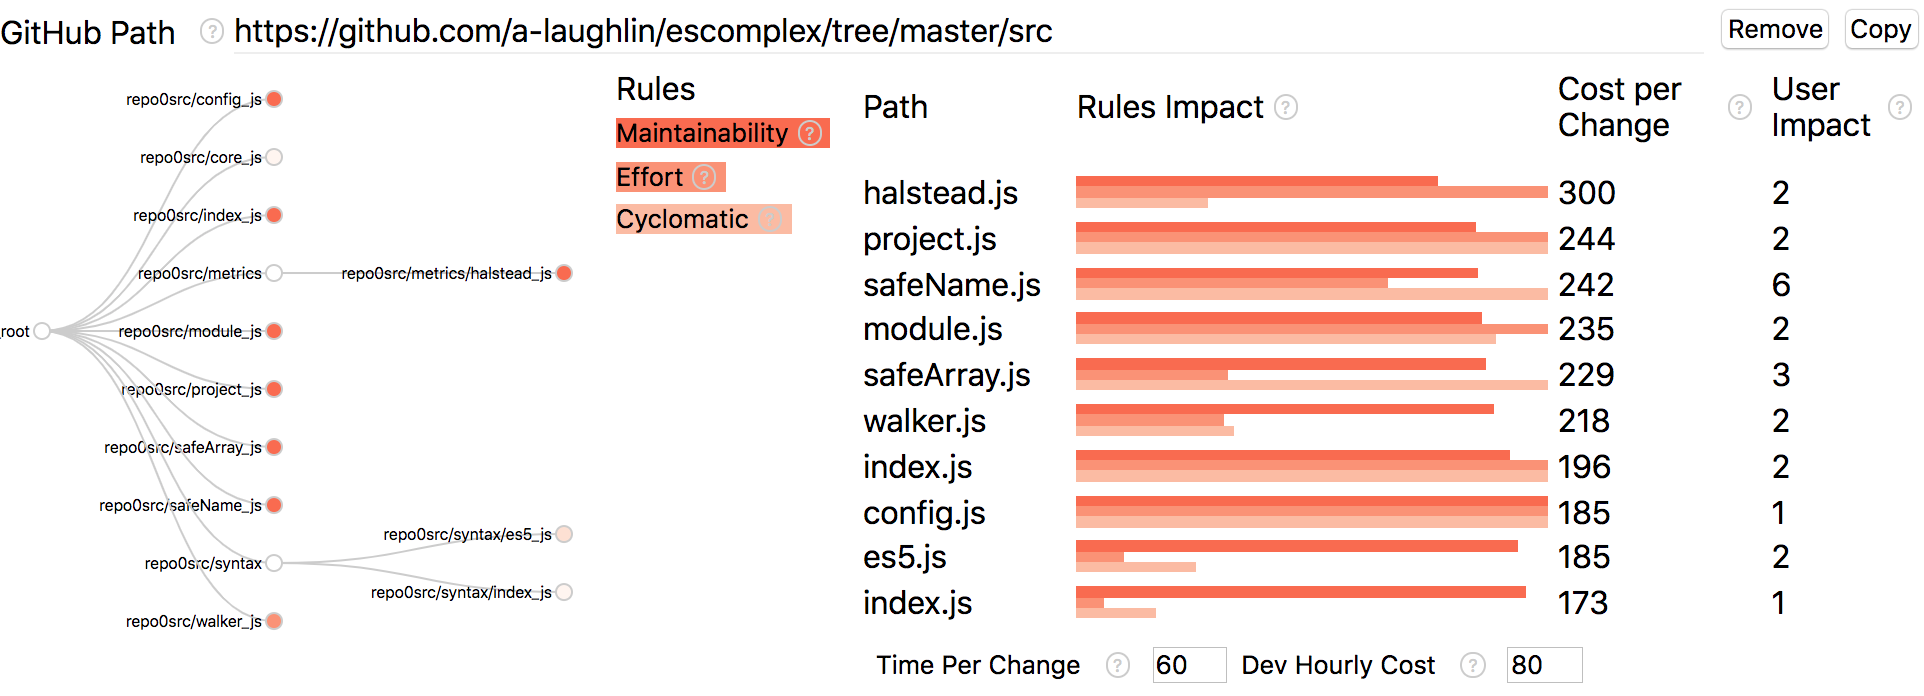
cost-per-change tree and bar charts

Which files have the highest return on refactoring? How much does it cost to make a code change to a given file currently? This project attempts to answer those questions for any arbitrary JavaScript repo (and versions within the same repo) through loading the code from github’s API and statically analyzing it for a number of factors.

The implementation pairs a redux store with XStream to establish a dataflow graph separate from the HTML tree, then maps that graph directly to the components where needed. I also implemented it with Mobx at one point, but didn’t like how Mobx played (or not) with other observables. Want to reimplement this one with hooks.

Tech: React, GraphQL (Apollo & Github), Redux, Xstream (Observables), Mobx.

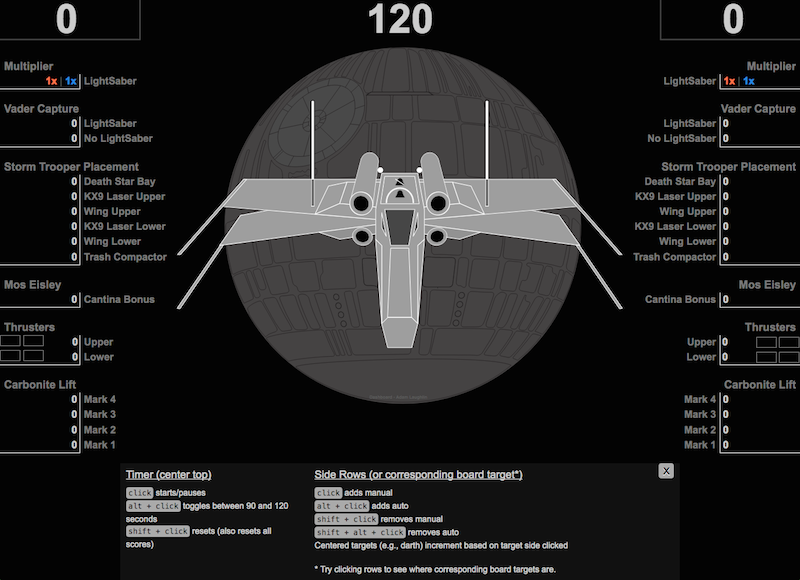
2017 MIT Robotics Competition - Interactive Scoring Visualization

2017 mit dashboard project thumbnail

Interactive Dashboard for the yearly MIT 2.007 Robotics Competition.
Stakeholders: Viewers 200-400. Students 100-200. Professors 2-4. Lab Staff 2-4. Scorers 2.
Requirements: SVG matches physical robot competition environment. Real-time updates. Undo & redo. Custom toggleable timers. Custom multipliers. Manual and Autonomous mode modifiers. Concurrently viewable by audience and unobtrusively updatable by scorers.
Technologies: Hand-coded SVG, D3.js, Lodash, RxJS. Basically reused the previous year’s code.

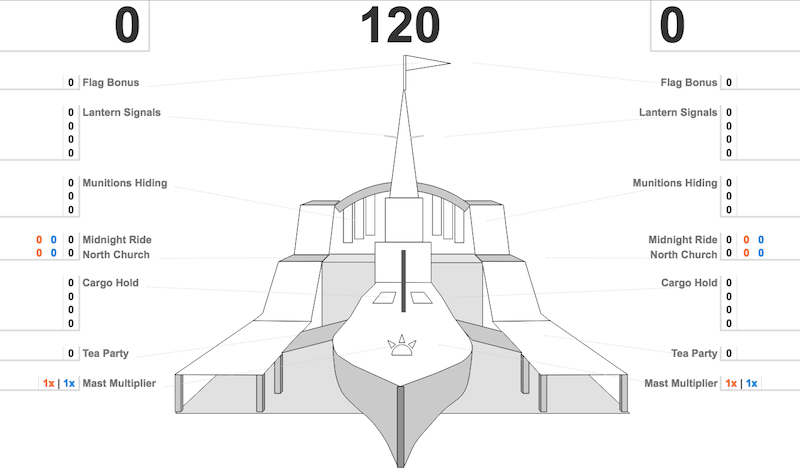
2016 MIT Robotics Competition - Interactive Scoring Visualization

2016 mit dashboard project thumbnail

Interactive Dashboard for the yearly MIT 2.007 Robotics Competition.
Stakeholders: Viewers 200-400. Students 100-200. Professors 2-4. Lab Staff 2-4. Scorers 2.
Requirements: SVG matches physical robot competition environment. Real-time updates. Undo & redo. Custom toggleable timers. Custom multipliers. Manual and Autonomous mode modifiers. Concurrently viewable by audience and unobtrusively updatable by scorers.
Technologies: Hand-coded SVG, D3.js, Lodash, RxJS, plus an oldie out of curiosity (jQuery).

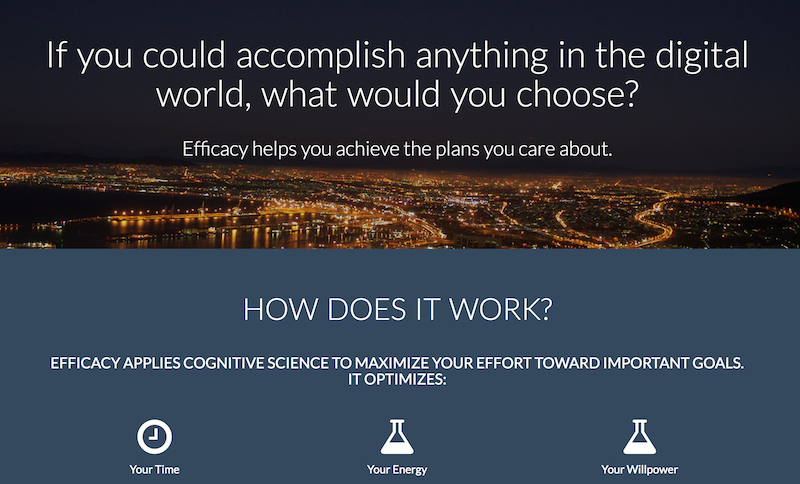
Efficacy.to

efficacy.to

Experimental desktop application improving both effectiveness and efficiency on computer-based tasks. Initial results reduced task switching time by 98% - from 2 minutes to 2 seconds. How many times do you switch activities during the day? Stakeholders: Myself. One intern. 2 alpha testers (Dogfooding). Tech: Electron, React, Redux, Nodejs, RxJS.

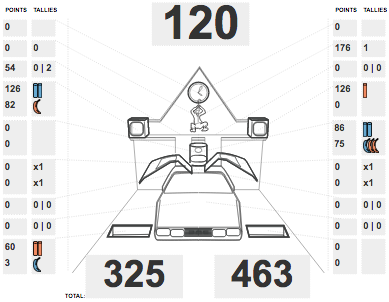
2015 MIT Robotics Competition - Interactive Scoring Visualization

2015 mit dashboard project thumbnail

Interactive Dashboard for the yearly MIT 2.007 Robotics Competition.
Stakeholders: Viewers 200-400. Students 100-200. Professors 2-4. Lab Staff 2-4. Scorers 2.
Requirements: SVG matches physical robot competition environment. Real-time updates. Undo & redo. Custom toggleable timers. Custom multipliers. Manual and Autonomous mode modifiers. Concurrently viewable by audience and unobtrusively updatable by scorers.
Technologies: Hand-coded SVG, Angular 1.

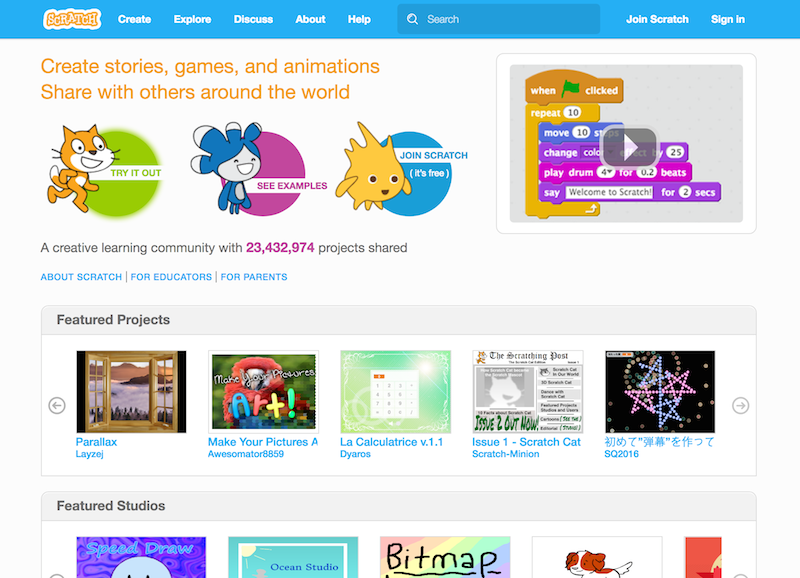
scratch.mit.edu

scratch project thumbnail

Community interaction front-end for Scratch - a project of the MIT Media Lab’s Lifelong Kindergarten Research Group that interactively teaches programming concepts. Enables creating, sharing, discussing, and remixing projects.
Stakeholders: 1 million+ users. 10-15 Research Group Professors, Staff, and Students.
Tech: Django. jQuery. Backbone.